
Instead of copying Microsoft 365 spreadsheets into reporting files, connect your SharePoint-hosted Excel data to Power BI, publish a semantic model, and schedule refreshes. This Microsoft 365 Power BI integration workflow keeps reports connected to the shared source without requiring someone to rebuild them after each update.
- Microsoft 365 Power BI integration works well with SharePoint-hosted Excel tables and scheduled semantic model refreshes.
- Use SharePoint Online List instead of Excel when your source is a structured operational register.
- Power BI sharing permissions and licensing remain separate from Microsoft 365 file access.
- Voll suits Portuguese businesses buying Microsoft 365 with local support; confirm Power BI licensing separately.
Voll is best for Portuguese businesses buying Microsoft 365 with local support. You can discuss your business licensing requirements with Voll, but define report authors, viewers, and source ownership before choosing the reporting setup.
Why this matters
A spreadsheet saved in Microsoft 365 is not automatically a live Power BI report. The connection, transformation rules, semantic model refresh, and report permissions are separate parts of the workflow.
For your 2026 reporting setup, connect to the cloud source rather than an employee's synced local folder. A local file connection depends on that computer's path and requires an appropriate gateway configuration for service refresh. A SharePoint Online connection avoids that dependency for this cloud-only workflow.
The result is repeatable reporting, not instant reporting. Changes become visible after the source is saved and the semantic model refresh completes; an open report can also need refreshing to display the updated results.
Before you start
- Accounts and access: Have a work account with access to the SharePoint site, Power BI Desktop on Windows, and permission to publish to the intended Power BI workspace. Confirm the author and viewer licensing requirements for that workspace; a Microsoft 365 subscription alone does not establish Power BI sharing rights.
- Source material: Prepare 1 source workbook containing a named Excel table, stable column headings, and a record identifier. Assign a source owner and a reporting owner. Avoid building the first report from personal files that disappear when an employee leaves.
- The gotcha: Use the SharePoint site address, not a file-sharing link or a locally synced path. Opening a shared link in your browser does not prove that the account used by Power BI can authenticate to the underlying site.
This guide uses English interface labels. Keep file locations, table names, and column types stable after publication; they become dependencies of the reporting model.
Choose the source that matches your process
Both approaches support imported reporting data. Neither makes the report update immediately whenever someone edits the source.
| Source option | Best for | Advantage | Limitation |
|---|---|---|---|
| Excel table in SharePoint | Teams maintaining an existing shared workbook | Preserves the spreadsheet workflow while adding repeatable reporting | Renamed tables, mixed data types, and spreadsheet edits can break transformations |
| SharePoint list | Teams maintaining a structured operational register | Gives records defined columns without relying on workbook layout | Person, lookup, and other complex columns need deliberate transformation |
Choose the Excel route when the workbook is already the agreed source. Choose the SharePoint list route when staff should maintain individual records rather than edit a reporting spreadsheet.
Source connection
Start the main workflow with a workbook stored in a team SharePoint document library. This also covers files stored in a Teams channel's underlying SharePoint library; use the actual site location rather than the Teams conversation link.
- Open the source workbook in Excel. Select the reporting range, choose Insert, then Table, and confirm My table has headers when the range includes headings.
- In Table Design, set Table Name to a descriptive name such as ReportingData. Save the workbook to the agreed SharePoint library.
- In Power BI Desktop, select Home, Get data, then More. Search for SharePoint folder, select the connector, and choose Connect.
- Enter the SharePoint site address. Do not paste the workbook's sharing link, a library view address, or a Windows folder path.
- Select Organizational account, choose Sign in, authenticate with the authorised work account, and select Connect.
- Choose Transform Data. In Power Query, filter Folder Path and Name until only the intended workbook remains.
- Open the workbook through its Content binary value. Select the named table and open its Data value to access the rows.
Expected result: Power Query shows the intended Excel table, and the query's source is SharePoint rather than a local drive.
Filter the file list before opening the binary. Otherwise, a second workbook with a similar name can become an accidental input when the library grows.
If your team still stores reporting files across personal accounts, settle ownership first. The business email and file migration guide covers the adjacent Microsoft 365 migration task.
Reporting model
The connection retrieves rows; it does not establish what those rows mean. Define the record grain before you build visuals: one row might represent an invoice, an invoice line, or a service request.
- In Power Query, inspect each column's data type. Keep identifiers as text when leading zeros matter, set monetary values to an appropriate numeric type, and set dates explicitly.
- For Portuguese-formatted dates or decimal values, right-click the relevant column and use Change Type, then Using Locale. Choose the matching type and locale rather than accepting an incorrect automatic conversion.
- Remove title rows, blank records, and spreadsheet subtotal rows that are not source transactions. Keep transformation steps understandable so another owner can maintain them.
- Select Close & Apply to load the data into the semantic model.
- Use New measure to define reporting calculations where needed. For example, sum a source amount column only after confirming whether it represents net value, tax-inclusive value, or another business amount.
- Build a report page with a total, a date-based visual, and a table showing record identifiers. These views let you check both the headline result and its underlying records.
- Add 2 test rows to a controlled test copy of the workbook. Give them known dates and amounts, save the file, and select Refresh in Desktop. Compare the report with the source.
Expected result: The report reproduces the source totals for the selected period, and each test record appears once at the intended reporting grain.
For a 2026 finance report, document whether the date filter uses invoice date, posting date, or payment date. Those definitions answer different questions even when the source rows are identical.
Do not fix mismatched totals by adjusting the visual. Inspect duplicate records, relationships, filters, and subtotal rows first. A chart that looks right can still contain an incorrect model.
Publication and refresh
Publishing creates the service-side report and semantic model. Configure refresh there; successful refresh in Desktop does not prove that the Power BI service has valid credentials.
- Save the Desktop report, select Publish, and choose the intended team workspace. Avoid using a personal workspace as the permanent destination for shared operational reporting.
- Open that workspace in the Power BI service. Find the semantic model, open its menu, and select Settings.
- Under Data source credentials, select Edit credentials where required. Authenticate to SharePoint Online with the appropriate organisational identity; use OAuth2 when that authentication choice is presented.
- Open Scheduled refresh, enable the schedule, and set the required time zone and refresh times. Place refresh after the source team's normal update window.
- Configure refresh failure notifications so the responsible owner receives them. Select Apply to save the configuration.
- Return to the semantic model menu and select Refresh now. Inspect Refresh history before distributing the report.
- Open the published report and confirm that the test records and totals match the saved source. Remove the test records from production data and refresh again before release.
Expected result: A service refresh completes successfully, and the published report displays the saved source changes without a Desktop republish.
Microsoft's documented limits distinguish refresh capacity: Power BI Pro supports up to 8 scheduled refreshes per day; Premium Per User and eligible Premium or Fabric capacity support up to 48 scheduled refreshes per day. These are scheduling limits, not promises that a refresh finishes at an exact time. Check the applicable Microsoft documentation when configuring your 2026 schedule.
For a cloud-only SharePoint Online source, an on-premises data gateway is not normally required. Adding an on-premises database, network file, or another gateway-dependent source changes that requirement.
Distribution and ownership
Source-file access and report access serve different purposes. Granting permission to the workbook does not share the Power BI report; sharing an imported report can expose data to readers who cannot open that workbook.
- Review the workspace access list. Give report consumers viewer-level access or distribute an app instead of granting editing rights simply to let them read results.
- Confirm sharing licences. In a shared-capacity workspace, authors and consumers generally need Power BI Pro; Premium Per User content requires the appropriate Premium Per User licences. Eligible capacity changes consumer requirements, so confirm the workspace's actual configuration.
- If you distribute through an app, select Create app, define the intended audience, and publish only the reports that audience should receive.
- Where different readers must see different records, configure row-level security in Desktop through Manage roles. Publish the model, assign the relevant users or groups, and test the roles before release.
- Test with a genuine consumer account, not only the report author's account. Check that the reader can open the report and cannot see restricted records.
- Record who owns the source, refresh credentials, semantic model, and audience membership. Include the handover process for an owner changing role or leaving.
Expected result: An authorised reader can open the report with the correct data scope, while editing and administration remain restricted.
For 2026 access reviews, inspect report permissions and source permissions separately. Row-level security does not restrict workspace administrators, members, or contributors in the same way it restricts viewers.
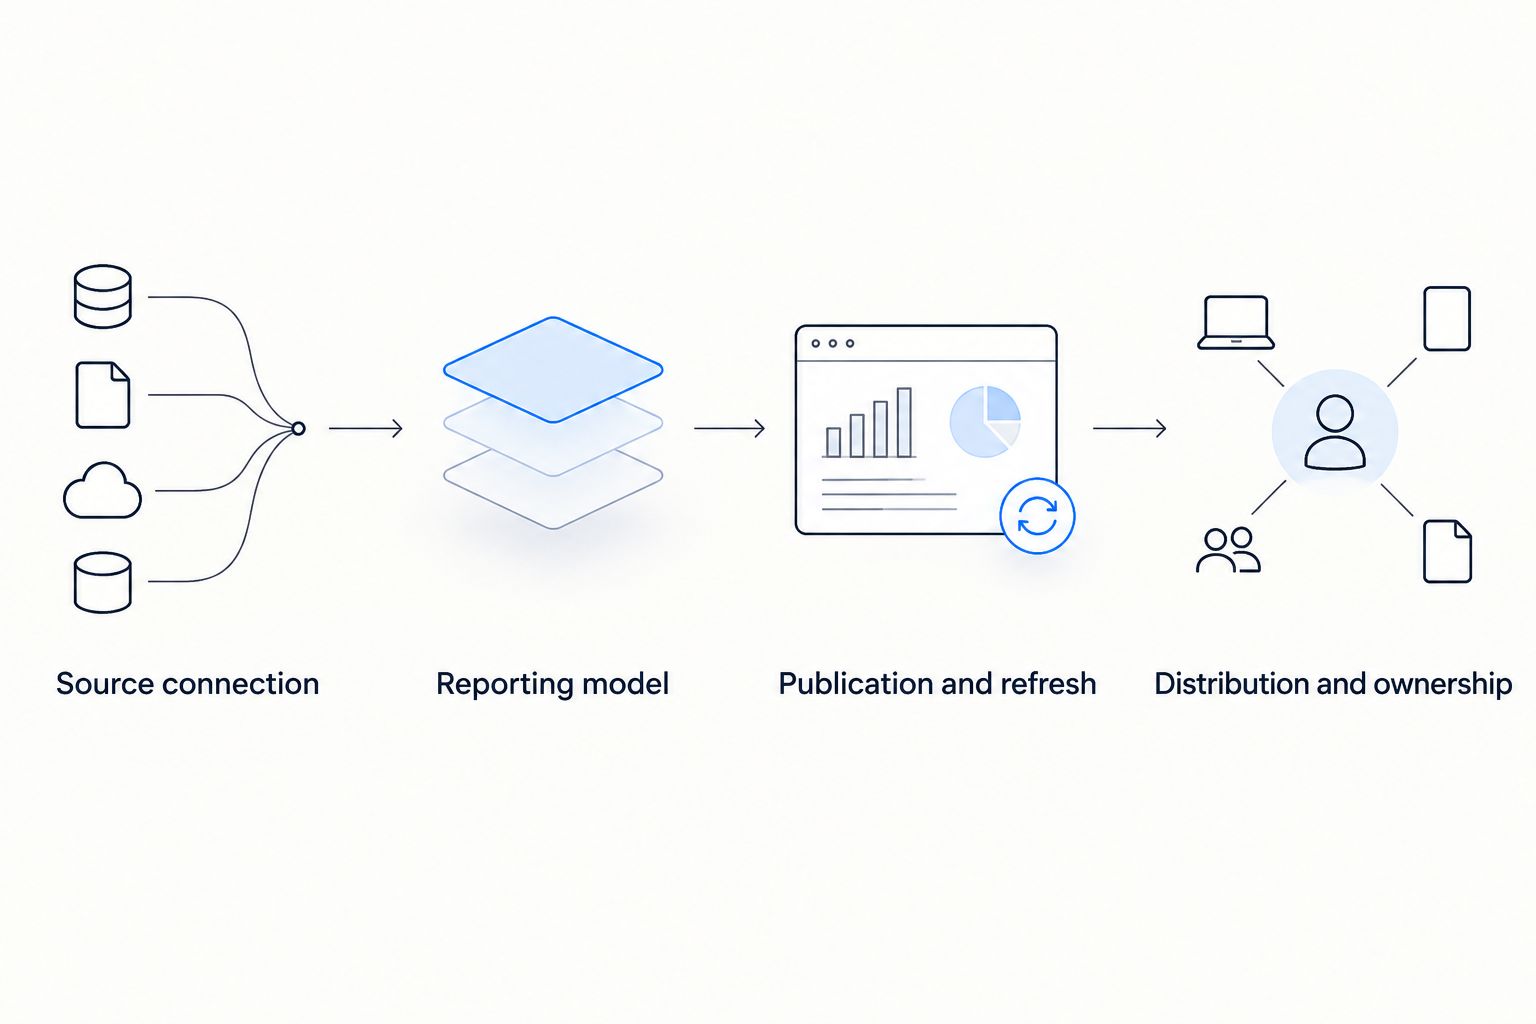
The workflow runs from Source connection through Reporting model, Publication and refresh, and Distribution and ownership. A failure at any stage needs a different fix.
Alternative: report on a SharePoint list
Use a SharePoint list when your team maintains a register of requests, inspections, projects, or other structured records. The publication and permission checks remain necessary.
- In Power BI Desktop, select Get data, then More. Search for SharePoint Online List, select it, and choose Connect.
- Enter the SharePoint site address and authenticate with Organizational account.
- In Navigator, select the intended list and choose Transform Data.
- Inspect person, lookup, and multi-value fields. Expand only the attributes needed for reporting, and check whether expansion creates additional rows per original record.
- Retain the list item identifier, set explicit types, and select Close & Apply. Build and publish the report using the same validation process as the workbook workflow.
- Edit a controlled test item, run Refresh now in the service, and verify the changed value in the report.
Expected result: Saved list changes appear after semantic model refresh without exporting the list to Excel.
A SharePoint list edit is not an automatic Power BI refresh trigger. This workflow uses scheduled or manually initiated refresh. Event-driven automation is a separate configuration with its own permissions and refresh constraints.
Troubleshooting
- The connector cannot find the workbook: Check the site address, account permissions, and the Power Query folder and filename filters. A browser sharing link is not a substitute for connector access.
- Desktop refresh works but service refresh fails: Open the semantic model settings and repair its service-side credentials. Check whether the query still points to a local path or includes a source requiring a gateway.
- Refresh succeeds but records are missing: Confirm that source edits were saved before refresh started. Inspect query filters, renamed tables, changed headings, and report filters before rebuilding the connection.
- Dates or amounts show conversion errors: Use Change Type, then Using Locale, on the affected columns. Correct mixed text and numeric entries at the source instead of silently removing failed records.
- Readers cannot open the report or see the wrong scope: Check app audience membership, report permissions, workspace licensing, and row-level security separately. Retest with the affected consumer account.
Customize your workflow
Start with one reporting purpose, then add sources that answer a defined business question. For a 2026 expansion, keep workbook data, ERP transactions, and manually maintained targets distinguishable until their identifiers and date definitions agree.
Voll supplies Microsoft 365 and business management software, with local support and ERP integration among its stated specialisms. Ask Voll to separate Microsoft 365 licensing from the Power BI access and integration requirements in your brief. That keeps a software purchase from being mistaken for a completed reporting project.
The advantage of this workflow is repeatable cloud-source reporting. Its limitations are equally clear: imported data has refresh delay, spreadsheet changes need control, and secure distribution requires separate configuration.
FAQ
How do I connect Microsoft 365 to Power BI?
Connect a supported Microsoft 365 source, such as an Excel table in SharePoint, through the appropriate Power BI connector. Transform the data, publish the semantic model, configure service credentials and refresh, then grant report access separately.
Does Microsoft 365 include everything needed to share Power BI reports?
A Microsoft 365 subscription alone does not establish the licensing needed for Power BI report sharing. Confirm author and consumer licences against the workspace's shared-capacity, Premium Per User, or eligible capacity configuration.
Does Power BI update immediately when I edit an Excel file?
An imported Power BI semantic model does not update immediately after an Excel edit. Save the workbook and complete a scheduled or manually initiated semantic model refresh; an open report can also need refreshing.
Do I need a gateway for SharePoint Online reporting?
A cloud-only SharePoint Online connection does not normally require an on-premises data gateway. Local files, on-premises databases, or other gateway-dependent sources in the same model change that requirement.
Is a SharePoint list better than Excel for Power BI?
A SharePoint list is better for a structured operational register, while Excel suits an established workbook-based process. List fields can require expansion, and workbook structures require control; both imported workflows depend on refresh.
Why does Power BI refresh work on my computer but fail online?
Power BI Desktop and the service maintain their own connection credentials. Repair the semantic model's service credentials and check for local paths or sources that require a gateway.
Can Voll help with Microsoft 365 business requirements?
Voll supplies Microsoft 365 for business customers and lists local support among its specialisms. Specify your report authors, viewers, sources, and ownership requirements, and confirm the Power BI scope separately.
One last thing
A successful refresh proves that the query ran, not that the report is correct. Keep a reconciliation check against the source total and record count. Run it after a column change, file move, new relationship, or reporting-rule change—not just on launch day.